Looking for Voter Fraud (in old elections) with Data Visualization
by Malte Skarupke
The 2020 US election is finally over, and all the election excitement of the last week reminded me of something I had been meaning to look into: Sergey Shpilkin’s data visualizations that clearly show fraud in Russian elections.
I generated the same visualizations for all US presidential elections from 2000 to 2016. The result is that I can’t find any evidence of fraud in any of those elections. But the visualizations show clear evidence of voter suppression of democrat voters. On closer inspection that turns out to be the effects of the electoral college system, which leads to a very interesting conclusion: You might already know that if the president was elected by popular vote, the US would only have had four years of republican presidencies from 1992 to 2024, with the rest being democrat. But these visualizations suggest that just looking at the popular vote actually underestimates the distortion of the electoral college. It also acts akin to voter suppression of democrats, without which national politics would swing even stronger to the left than the popular vote suggests. But lets start by looking at Sergey Shpilkin’s work:
His core idea was to plot voting results by turnout. Here is what one of his plots looks like, for the 2018 Russian election:
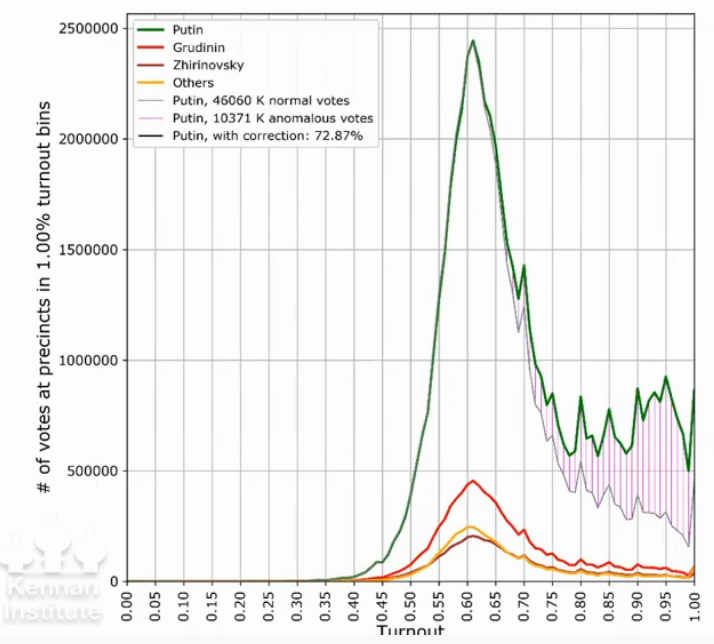
Graph taken from this video.
Lets go over what this means, because we’ll be looking at a few of these graphs. On the X-axis we have voter turnout, on Y-axis number of votes. The peak is close to 60%, this means that most precincts in Russia had a voter turnout of roughly 60%, and most votes fell in those precincts.
Plotting this correlation, you would expect it to be roughly look like a bell-curve. (I know it’s not a “bell-curve”, but my statistics knowledge isn’t good enough to name the actual distribution that this should follow, and lots of curves look roughly like a bell…) Meaning we’d expect it to concentrate in the middle, then flatten out to the left and right. But something weird happens on the right:
On the right side of the graph the number of votes doesn’t go down. It’s weird to see so many votes cast in precincts that have 95% or even 100% voter turnout. It’s completely unrealistic that millions of voters would live in precincts where every single person votes. Sure, if a precinct had only 100 people living in it, you could conceivably imagine that they somehow get organized so that everyone votes, but the Y-axis is far too high.
Also those people are voting for Putin a lot more than the people in the middle did. The shaded red area is the amount that these are voting more for Putin than in the middle. Meaning even if we were to believe that some precinct achieved 95% voter turnout, the shaded red region tells us that Putin received a higher percentage of the vote than we’d expect based on the middle section of the graph.
We also see suspicious peaks around round numbers: 80% and 85% have peaks, which suggests that the government isn’t even trying to cover its tracks. They just decided that they’d get a nice round number of 85% voter turnout, and then doctored the numbers to look like that.
The peaks at round numbers make the fraud super obvious, but even without them we could have concluded fraud here: All we need to see is that this isn’t bell-shaped, and that Putin is getting a suspicious number of votes in the odd region.
To really drive the point home, here is the result of the 2020 vote for a new Russian constitution:
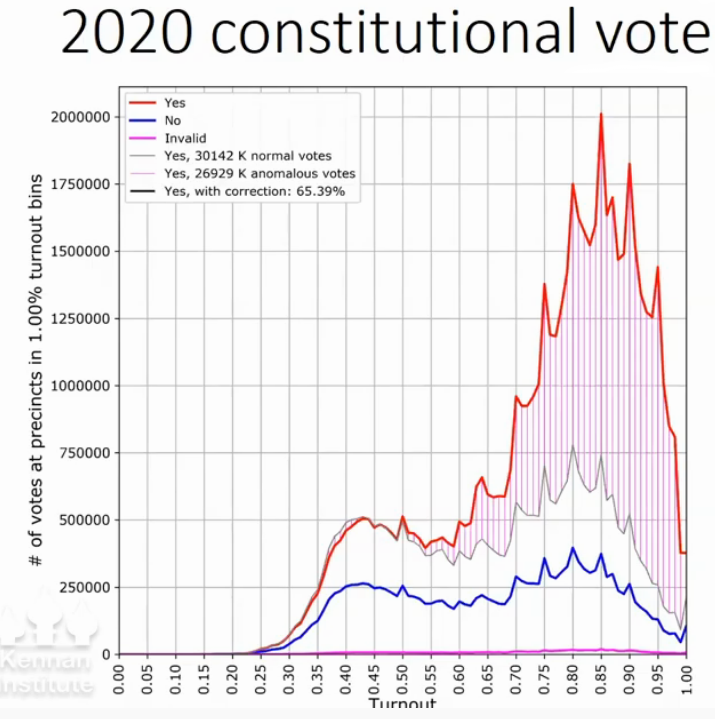
For this one Putin has stopped pretending and just completely fakes the numbers. The spikes on round numbers are even more obvious now, and this no longer resembles anything that would look like a bell shape.
A second plot that Shpilkin likes to use is to do a scatter plot of turnout vs percentage of votes. Meaning instead of the absolute number of votes as above, plot the percentage that voted yes. Here is what that looks like for the same election:

This is a screenshot taken from the same video I linked above. That’s Sergey Shpilkin up in the corner, in the process of giving a presentation about these graphs, because I literally can not find these graphs anywhere else on the Internet…
So what do we see here? This scatter plot is supposed to show a perfectly round blob shape. Instead we see a red tail going off to the top-right, and a blue tail going down to the bottom-right. This means that as turnout gets higher, more people are voting for “yes” and fewer people are voting for “no”. This shows the same thing as the red-shaded area in the previous plot: Even if you did believe the crazy high turnout numbers, it’s still suspicious that all those people with the higher turnout decide to vote for Putin.
Another thing we can see here (unfortunately it’s blurry because I had to take a screenshot from a video) is a checkerboard-pattern in the right-most area, where the dots align to the grid. This again shows that the numbers are fake, aligning too well to round numbers.
US Elections
I’ve kept you waiting long enough. Here is that last graph, but for the 2016 US presidential election:
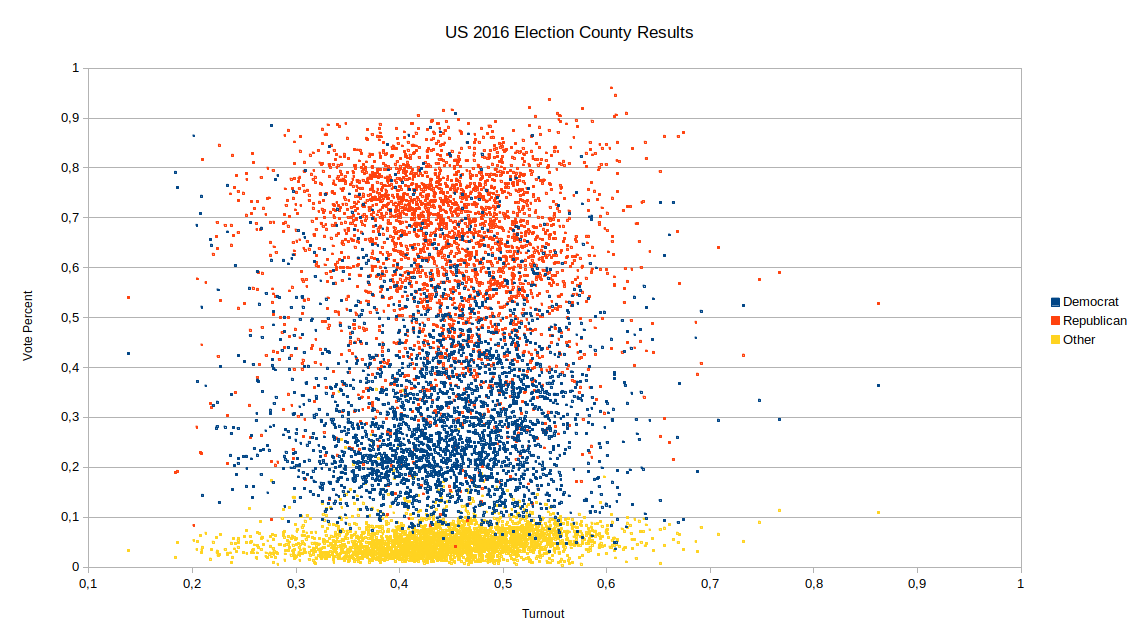
This looks as close to a blob shape as you can expect. I spot-checked a few of the outliers, but they’re mostly tiny counties with a thousand people living in them. And they’re not even in swing states. For example the dots all the way on the right are Mineral County in Colorado, population 769.
One clarification: The turnout number at the bottom is slightly wrong: You’d think that you can easily get these statistics for past elections, but I can’t find the turnout number anywhere. Instead I was able to get the population of the counties, so this is the number of votes divided by the population. Normally you would only use the part of the population that’s old enough to vote, but I think this shouldn’t introduce too much bias.
If you’re wondering why most counties have more red votes than blue votes, even though the democrats won the popular vote in 2016: The answer is that there are an awful lot of small counties. And a lot of those have their red dot higher on this plot than their blue dot.
To get a feeling for the absolute numbers, lets look at the other plot, with the total number of votes:
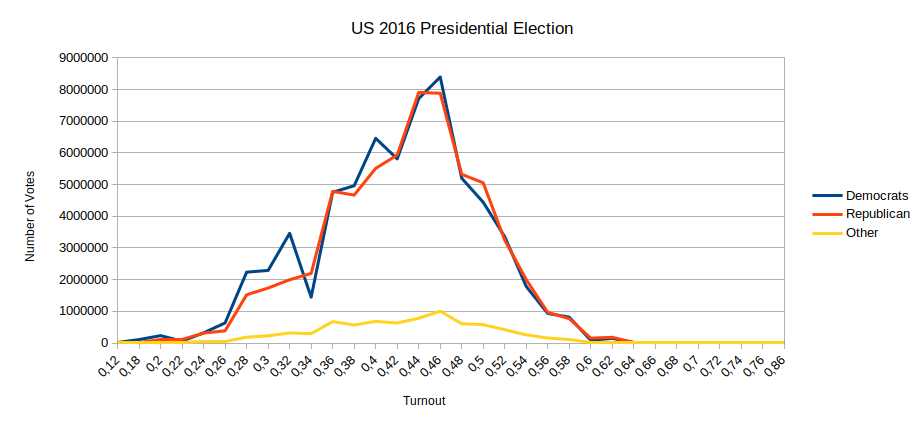
This looks close to what you’d want this graph to look like: No county has suspiciously high turnout, and the high turnout counties don’t trend towards either party. Meaning once again no evidence of fraud here.
But the left side looks odd: Why are there so many democratic votes in counties with low turnout? This is exactly what voter suppression would look like on a graph like this: If you don’t want the democrats to win, you’d somehow make sure that all of their counties have low turnout. For example by having too few polling places. Or by preventing people from voting in other ways. (like “accidentally” removing them from the list of registered voters)
Or is this just an effect of the 2016 election? Republicans did have unusually high turnout because they got excited about Trump. That explains this partially, (it’ll be clearer once I smooth this graph, further down) but it doesn’t explain why we have these large spikes on the left.
Looking into it, the biggest spike on the left, at 0.32, is mostly caused by Los Angeles in California, with 2.4 million votes for democrats. The bucket to its left, at 0.3, has as its biggest democrat contributor Brooklyn, NY, with more than 640k votes for democrats, then two other California counties with ~350k votes each for democrats, and then San Antonio, Texas with 320k votes for democrats. And the bucket to its left, at 0.28, is mostly caused by Houston, Texas (700k votes for democrats), Queens, NY (510k) and Dallas, Texas (460k).
So why don’t these people vote more? Because of the electoral college. Lets say Los Angeles really gets its act together and increases its voter turnout by 50%, to 0.48, so they would contribute 3.6 million votes for democrats. It wouldn’t make any difference to the election at all. Literally zero. Once California has been called for democrats, any additional votes are ignored. So the people in California aren’t stupid. They know how much they have to vote to make their party win, and they don’t put in any extra effort to encourage people to vote more. It would just be wasted effort.
The Texas counties suffer from the opposite problem: Texas always goes to republicans. So people are discouraged because it feels like no matter how much they vote, their vote doesn’t matter because once Texas has been called for republicans, all the democrat votes are ignored. But the situation is different here: If Texas cities had really high voter turnout, Texas would look a lot better for democrats. Currently democrats in Texas are still discouraged because historically their vote has been tossed out, but the state is slowly moving to the left, and if democrats can mobilize the cities, Texas might turn into a swing state soon. (I know they’ve been saying that for years, but the above graph is more evidence for it)
But I want to highlight how this explains one of the biggest weirdnesses about US politics for me:
The Missing Left in US Politics
As a German, US politics has always felt oddly right-leaning. Since I’ve been paying attention to politics, the US had the following presidents: Clinton (center-right), Bush (right), Obama (center), Trump (far right) and now Biden (tbd, but historically center-right). There has never been a center-left or left-leaning government.
Americans might disagree about these categories with me, but let me give you my context from German politics. Angela Merkel, the German chancellor, is generally perceived to be center-right. To contrast that, let me list some of Angela Merkel’s accomplishments:
- In the 2008 financial crisis (and now again) the government paid part of workers’ wages to save jobs (Kurzarbeit)
- She stopped mandatory military service
- Germany is getting out of nuclear power by 2022
- Germany is getting out of coal power by 2038
- She ran a balanced budget
- Legalized gay marriage
- Accepted a large number of refugees from war-torn Syria
- Cut taxes (Solidaritätszuschlag) for the working class and middle class, while keeping them in place for the upper class
If you did one of these things in the US, you would be considered a progressive leftist. Doing all of them would make you a radical. In Germany she is still considered center-right. (to be fair, she also did plenty of things that would be considered right-of-center in the US, but the point is that you couldn’t imagine republicans in the US doing any of the above)
As far as I can tell the categories are similar in most of Europe. For example no right-leaning party in Europe would argue for the same healthcare system that we have in the US. They would all argue for universal healthcare. It’s only in the US that everything is shifted further to the right, so that not even a “center” president like Obama could make universal healthcare happen.
This has always been a puzzle to me, because Americans don’t seem that different from Europeans. The above graph is the first satisfying explanation that I have seen: The electoral college distorts things far more than I thought. Yes, if the popular vote decided, the last 30 years would have been democratic rule, but even that underestimates the effect. Because without the electoral college, places like Los Angeles and New York would actually vote more. Then the popular vote would shift even further in favor of democrats. The USA would become a lot more normal, more like European countries.
And I don’t even think it would be bad for republicans. I live in New York City, and I was curious about the republican that was running in my neighborhood. After watching a video of him speak, he seemed like a perfectly nice guy, but he had no chance at all. To be a republican meant being aligned with Trump. But if national politics shifted further to the left, republicans would also shift into the mainstream, and they would suddenly have a chance in the cities again. Until then they’re being held hostage by the distorted results of the electoral college, and can’t move to more popular positions, and all the republicans running in cities have no chance.
Past Elections
For completeness, I generated that last graph for all US elections going back to 2000. Mainly because it was easy to find numbers for those. (except for the turnout number, so they all have the same distortion of using total population to calculate turnout)
That being said, when the graphs were spiky like above, it was hard to see trends between the different years. So I decided to smooth them further. Here is what that looks like for that last graph, from 2016:
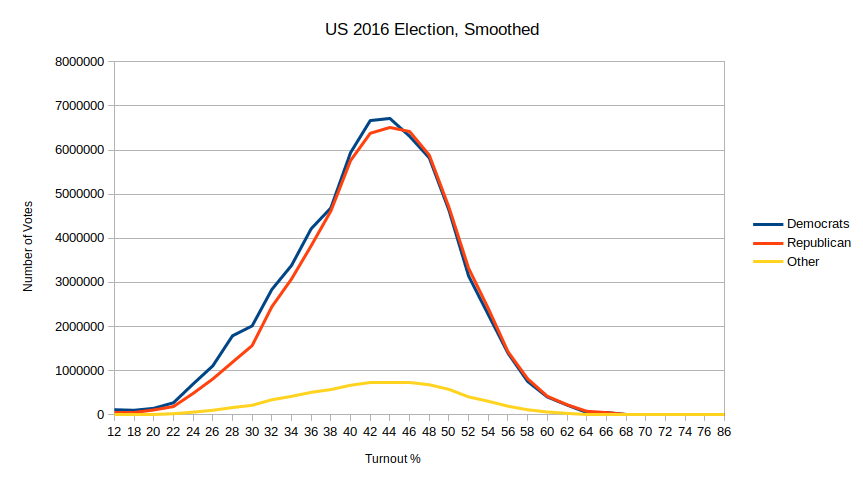
Yes, this smoothed version is less informative, but it is easier to compare between years. Here is 2012:
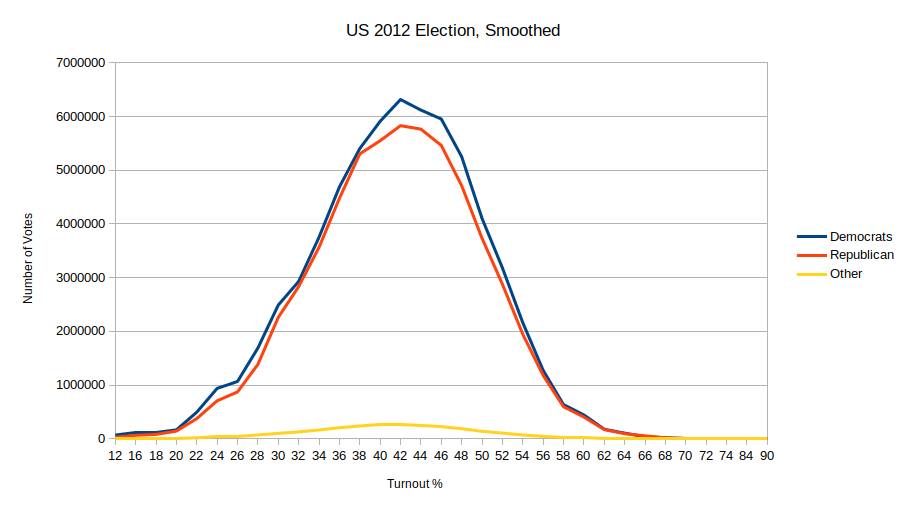
It’s clear that the democrats won this one. And not just the popular vote, as in 2016. You almost don’t see the disproportionate number of democrats in low-turnout counties. You can also compare this one to 2016 to see how Trump increased voter turnout.
Here is 2008:
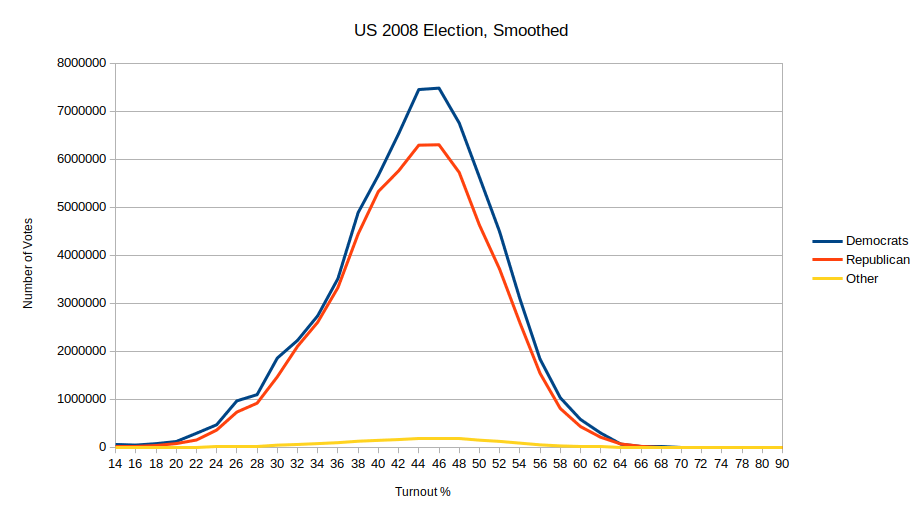
Main conclusion: Obama sure was popular the first time around.
Here is 2004:
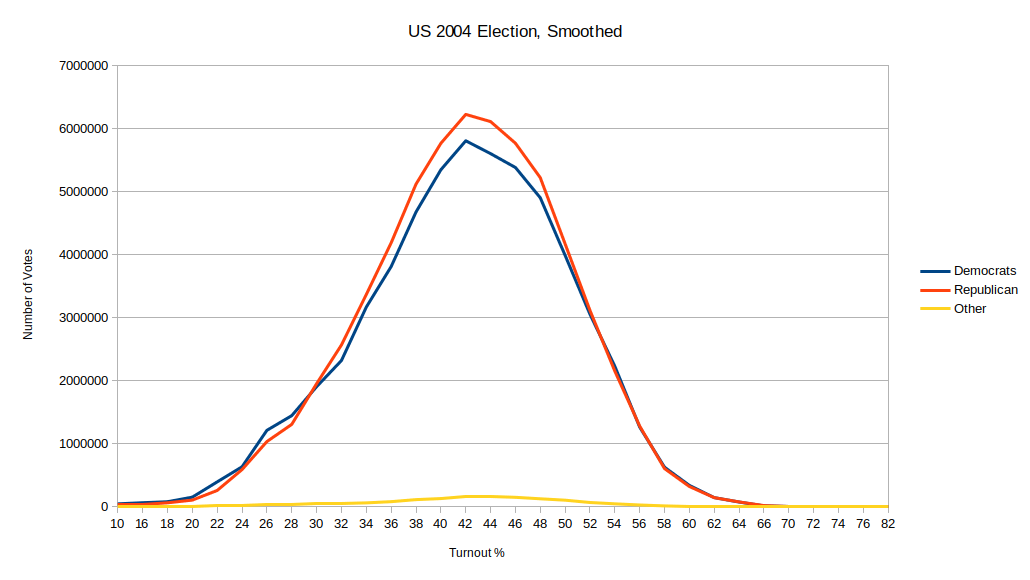
Once again when the democrats lose, the oddity on the left side of the graph stands out more, even if it’s smoothed out here. (compare to how there is no oddity on the right side)
Finally, 2000:
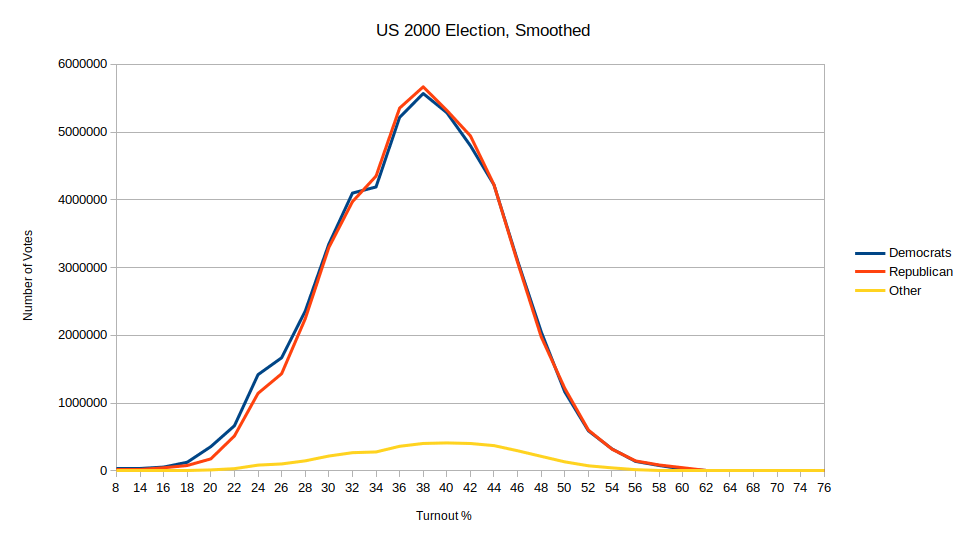
And there you go, once again a plot that looks an awful lot like voter suppression of democrats.
Conclusion
The first conclusion has to be that I found no evidence of fraud in any of these elections. If there was fraud, it can not be shown with this visualization. But I don’t suspect that there was, at least not at a large scale.
The bigger conclusion is that I finally found an explanation for myself for why the US is so odd, politically. The electoral college distorts far more than I thought. It’s not that Americans are fundamentally different than Europeans or Asians, it’s that the electoral college distorts twice: by allowing less popular candidates to win, and by acting as voter suppression, making it harder to find out who would actually be popular.
After doing this work, I decided to donate to National Popular Vote, who are making good progress in converting the country to elect the president using the popular vote.
I also donated to the Center for Election Science, who are trying to make local elections less divisive.
If you don’t like US politics and wish it was more consensus-driven, more center-aligned, and more boring, I think these are good causes to donate to.
The code and data for this blog post is uploaded here.

This is too high level. You would have to look at individual state levels, particularly swing states.
I had checked a few states as well, and there are a few more outliers, but every time I looked into them, I just found more details that can explain them. And talking about all those details in the blog post would have been exhausting. I didn’t find anything that was suspicious enough that I thought I needed to put more work into state-level analysis.
For example here is the graph for Michigan in 2016:

First of all this is super noisy, because there aren’t that many counties. So that alone makes it hard to analyze it. If I find something suspicious, how do I know it’s not just noise? To make it less noisy I’d have to do analysis at the precinct level instead of the county level, but I don’t know if I can get population numbers at that detail. And if I can’t get population numbers, I can’t calculate voter turnout.
The most obvious thing is that big blue spike on the left. That’s Wayne County which contains Detroit. Why was voter turnout there so low? Should we be suspicious? Maybe, but more importantly what are the chances that nobody has noticed that voter turnout in Detroit was low in 2016 and that that caused the state to flip and that I would find something new? Probably slim. These things have probably been pored over many times.
My analysis here would only find suspicious things if there were too many votes all the way to the right of that graph. Just to be sure, I spot-checked the right-most counties and they are Leelanau County and Antrim County:
https://en.wikipedia.org/wiki/Leelanau_County,_Michigan
https://en.wikipedia.org/wiki/Antrim_County,_Michigan
Wikipedia says that both of these basically always vote republican. So that’s not too suspicious then. You could of course still argue that these counties are perfect places to hide ballot stuffing, in which case I’d have to admit defeat. If they did create fake votes, they did it at a small scale and only in places where it would look plausible anyways, thus hiding their tracks well. This visualization isn’t magic, and it can only really help find large scale shifts like in Russia, or the large-scale voter suppression of democrats that the electoral college causes.
Finally, to do a good job of analysis at the state level, I’d need to know state-level politics, and I don’t. So since an initial check found nothing suspicious, I didn’t investigate state-level results any further.
That being said I made all the data available here:
https://github.com/skarupke/shpilkin-election-visualization
Doing state-level analysis is pretty easy with that starting point. I just redid the Michigan analysis in ten minutes while writing this comment.
The statisticians making early calls on elections are very refined. Look at elections before 2000 and try to make correlations to exit polls. Notice how in 2020 predictions for some jurisdictions are only called when it is an arithmetical certainty while for other elections practically as soon as the voting stops. It would be interesting to see if the pollsters are applying different confidence intervals for different states. Before exit polling as an aid to calling elections was introduced, it was said that some county or precinct returns could indicate the ultimate outcome.
Have a look at the work by Klimek et al, https://www.pnas.org/content/109/41/16469.short
Titled “Statistical detection of systematic election irregularities”. Provides the visualisations you’re looking for.
Thanks, that is close to what I was looking for, but when I said “I can not find these graphs anywhere else on the Internet” I was specifically referring to the graphs about the Russian elections in 2018 and 2020 with English labels. Google can find some of them in Russian for me, but I don’t know where to find them in English. The paper you link is good, but it’s too old to contain the results from 2018 and 2020.
I fully agree on your thoughts when comparison EU politics with US in terms of “left-center-right”. Angelika Merkel is considered center-right, but many of her decisions are very left. I find this fact refreshing and Im proud of this actually even if I would not vote the CDU at all (yes, I prefer it more radically left), but I have to admit I like her style.
I just wish there was a more EU like political style in the US as well….Bernie Sanders was a hope for me.
Would love to see this analysis done on the preliminary 2020 data, especially with some people very concerned about potential voter fraud.
I think it’s too early to run it on the 2020 results. New York and California are still counting votes, so you wouldn’t be able to detect the same effect that I saw above.
I don’t know when they usually announce the final counts, but you’d want to run this analysis on that.
The most interesting piece I read for the whole election. Thanks.
Also interesting in relation: https://en.wikipedia.org/wiki/Party_divisions_of_United_States_Congresses
Further reading on why the US isn’t a pure democracy:
* https://en.m.wikipedia.org/wiki/Federalist_No._10
* https://en.m.wikipedia.org/wiki/United_States_Electoral_College
Good comment on hacker news about pure democracy.
elcritch 8 hours ago | parent | on: Looking for Voter Fraud (In Old Elections) with Da…
Primarily because the original states were sovereign before creating the union, and they formed a republic that maintains some level of autonomy for states, as the people in those states wouldn’t want to loose their sovereignty completely. California and Texas joined because the benefits of the larger union outweighed staying independent (no doubt Texas second guesses that at moments). Fast forward a hundred odd years, and the system while somewhat unfair on a per count vote still at the federal level still allows for greater overall autonomy for citizens of different states. California can and does use its clout and local autonomy to make laws that its population wants (e.g. car emissions standards) without forcing the same on the rest without more effort. It’s also why the increase in federal power and presidentialism in both major parties leads to less overall individual autonomy and control, IMHO. Even with a direct 1-1 vote count, a single vote for a president out of a 100+ million votes has much less effect than the same vote for a governor in a state with a population of even tens of millions of people. Generally, the federal government should only make laws that need to or can only be made nationally. The rest should be state level. Its less efficient but generally considered more robust. Also, to a degree the idea of a republic of states implies that the 4 million people of LA cant readily “group-think” the rest of the people in the union into whatever laws enable or inhibit whatever lifestyle/beliefs/etc they want via the federal government. In that sense it maximizes the fairness of “tribes of people” slightly over that of single individuals, which seems consistent for a republic rather than a more direct democracy.
I broadly agree, but this seems orthogonal to the electoral college, no? I agree that different states should be able to have their own laws, and that the federal government shouldn’t decide too much, but even in that situation you’d still want a federal government that best represents the will of the people, without too many distortions.
Can you explain how this relates to the electoral college? Or is this in response to something else in the blog post?
So the electoral college basically ensures that each state gets a “fair” representation in the federal government. This matters because each state has its own government, so it is important that each of these autonomous governing units gets equal representation. The electoral college is basically a population-weighted/normalized metric to try to achieve this.
A lot of people don’t know that the electoral college is based on the population in each state, so if you lose/gain a lot of residents the number of electoral votes for that state will also change. Essentially, the electoral college is an attempt to balance state sovereignty with federal representation in a way that is normalized by population. Without the electoral college, a few of the most populous states (like California) would disproportionately influence the federal elections, resulting in the larger state governments imposing their will on the smaller states through the federal government.
This normalization is not perfect and breaks down at the extremes (ie Rhode Island getting 1 vote), but it is fairly reasonable, erring on the side of making sure the less-populous states are over-represented rather than under-represented.
Thanks for the comment, Bob. It helped me understand how this is related. I posted a lengthy response to Cam Hart’s comment below.
“She ran a balanced budget” – this is more in alignment with the right.
https://en.m.wikipedia.org/wiki/Balanced_budget_amendment
Maybe in Europe it is, so this might be another example of the further shift in the US. In the US the right has not run a balanced budget in a long time, but the left keeps trying to. Here is a graph of US debt divided by US GDP:

Source:
https://www.wolframalpha.com/input/?i=us+debt+%2F+us+gdp
I’m plotting debt per GDP, because that is the number that ultimately matters, not the absolute amount. We saw that it reached a low point at roughly 1982, then it went up under Reagan and Bush Senior. Clinton managed to bend the curve and lowered it, only for Bush Junior to immediately increase debt again. We see a huge increase at the end of the Bush years because of the financial crisis. This is mostly caused by two stimulus packages, one of which was passed under Obama. So maybe Obama is partially responsible for for that increase. (though he had very little choice, given the situation that Bush left him with) But by the end of the presidency he had bent the curve again and it was flat instead. Trump immediately cut taxes for the rich, so this graph goes back up slightly again, ending with another huge increase at the end of this term, (barely visible at the end of the graph) caused by his disastrous coronavirus response, which required another massive stimulus package.
Hard to make the case from this graph that Republicans are trying to run a balanced budget. If we assume that Merkel and Clinton are both center-right, then maybe we could argue that running a balanced budget is a policy point of the political right. But that just further strengthens my point that the US is weirdly shifted further to the right and that this is a policy point which in the US would be associated with the left, and in the rest of the world it wouldn’t.
When it comes down to policy, I’ve never seen the left agree to balance the budget in America. The right has argued for it on many occasions.
“House Republicans are considering a vote on a “balanced-budget amendment,” a move that would proclaim their desire to eliminate the federal deficit even as they control a Congress that has added more than $1 trillion to it. Follow the latest on Election 2020
The plan is expected to have virtually no chance of passing, as it would require votes from Democrats in the Senate and ratification by three-fourths of the states.”
https://www.google.com/amp/s/www.washingtonpost.com/news/wonk/wp/2018/03/28/republicans-consider-balanced-budget-amendment-after-adding-more-than-1-trillion-to-the-deficit/%3foutputType=amp
Some further googling seems to show a potential shift here though, with new young Democrat voters wanting a balanced budget to be a priority. Historically it never was the democratic parties policy at least from what I’ve observed/been taught.
Though your points are valid–Presidental behavior hasn’t aligned with party views on this.
Just came across this. Sounds like it is another difference between left/right views once you cross the ocean.
“In many other countries, economic liberalism or simply liberalism is used to describe what Americans call fiscal conservatism.”
https://en.m.wikipedia.org/wiki/Fiscal_conservatism
“Fiscal conservatism, on the other hand, is the belief that the economy functions best with minimal governmental influence. Fiscal conservatives often support lower taxes and less regulations (i.e., laws and rules on how a business is allowed to operate). They tend to be proponents of free-market capitalism, the belief that capital (usually defined as money) is best allocated without government direction.
Fiscal conservatives believe that individuals and companies can best respond to the demands of consumers, instead of a government bureaucrat. For example, fiscal conservatives oppose socialized medicine, where the government decides how much doctors make, what treatments are allowed, and millions of other decisions….Supporters of fiscal conservatives can have different names and comprise different groups. Most fiscal conservatives are members of the Republican Party, although some may be members of the Libertarian Party. ”
https://study.com/academy/lesson/social-conservatism-vs-fiscal-conservatism.html
I’m just pointing out the history behind the electoral college/constitution as an explanation to why we don’t have the popular vote choosing the president.
The federalists paper #10 seems especially focused on this indicating it’s to prevent factionalism (at both Congress and executive levels from what I understand).
The founding fathers believed the electoral college would help “control” (but not prevent) factions from adversely impacting others rights.
Supporting things like https://www.nationalpopularvote.com/, seem to disregard the risks of factionalism and go contrary to the constitution in my opinion. I see they attempt to argue out of this at https://www.nationalpopularvote.com/answering-myths. That’s a perspective. But I don’t believe it’s honest/fair/unbias to label it as “myths”. Its their perspective.
Not trying to fight/argue here. I found your post interesting, and it led to me doing some more research for myself. Just figured I’d share.
I have family from Germany. They can’t fathom the idea of Trump. When I speak with them I find they often have one perspective from the media with US politics and aren’t being exposed in anyway to the politcally right side (by US definition). I’m finding https://www.allsides.com/unbiased-balanced-news to be a good resource in this regard. Anyone blindly believeing news sources don’t apply a bias is wrong. Both left and right do. We should do a better job at being exposed to more of both sides. It’d help people understand each other more, potentially open up our minds to other ways of thinking, and ideally, at a minimum, reduce some of the hate people harbor for opposing political views.
Debate is good. It’s necessary. Flame wars… they actually just attempt to undermine democracy.
Thanks for the news source! It’s pretty hard to find fairly objective and unbiased information these days.
OK, I think I get it. The concern is that the electoral college is one of the safety measures that prevents one side from getting too powerful. And we should always be extra careful when getting rid of a safety measure like that.
The reason why I didn’t understand the concern at first is that Germany doesn’t have the electoral college, and it has no problem in this direction. In fact it has fewer problems in this direction, having smaller parties who always have to form coalitions in order to rule, encouraging compromise.
But I now realize that Germany has several other safety measures to prevent one group from getting too powerful.
For example in Germany you don’t vote directly for the chancellor. Instead you vote for the parties, and the German equivalent of the house of representatives elects the chancellor. That one level of indirection already would have made it much more difficult for Trump to be elected. (because remember, the republican party very much didn’t want Trump as their candidate in 2016)
Second example: the German equivalent of the house of representatives is elected with a proportional vote. There are direct mandates, similar as in the US, but after all the direct mandates are filled, the seats are filled up in proportion to the votes. Meaning if a party gets 10% of the vote, it gets 10% of the seats. In the US a party that gets 10% of the vote would probably end up with 1% or fewer seats, because you have to get more than 50% in a district to get a seat. The proportional assignment is another safety measure because it leads to no party ever getting more than 50% of the seats.
Third example: Germany also has the same division between federal government and state governments. So for example the coronavirus response in Germany was different depending on which state you’re in, just like in the US. And there is also an equivalent of the senate, where each state gets roughly the same amount of seats (except that it has a smaller distortion than the US senate).
The reason why I picked these examples is that they illustrate three different forms of safety measures:
1. Add a level of separation between voters and the decisions. Don’t allow them to vote for the chancellor directly.
2. Allow diversity to flourish, giving people the chance to vote for the party they really want, even if it’s a small party, because a proportional vote and coalition forming means that even small parties can be important.
3. Give smaller groups a disproportional say by giving them more than their fair share of seats in the senate.
And you’d really want a fourth one in there, though you have to be careful with this one:
4. Sometimes allow voters to directly vote for something, without having to go through representatives. (e.g. marijuana legalization in the US)
It’s good to have a diverse set of safety measures that work in different, competing ways. That way one group can’t become too powerful just because it has an advantage in one of these areas.
The electoral college probably falls into point 3 above. Maybe it was also supposed to address point 1, but it really doesn’t do that any more. But we also have the senate to address point 3, so the electoral college isn’t as necessary. Maybe it’s even actively harmful, because it is one of the reasons why the US doesn’t have any safety measure that works according to point 2 above.
And finally the distortion of the electoral college is a risk in itself. If Trump had been more dangerous, he could have done real damage to the democracy. So you have to gauge which risk is bigger: The risk that the distortions of the electoral college would allow a more dangerous candidate to become president, or the risk that a lack of the electoral college would allow one side to become too powerful. We had a near miss with Trump, where he wasn’t really as dangerous as we had feared, but based on that experience I think having the electoral college is the bigger risk.
“In fact it has fewer problems in this direction, having smaller parties who always have to form coalitions in order to rule, encouraging compromise.”
This is interesting–I like the idea of encouraging compromise. Are there situations where a non-majority backed individual could be elected Chancellor?
“We had a near miss with Trump, where he wasn’t really as dangerous as we had feared, but based on that experience I think having the electoral college is the bigger risk.”
I think fear over Trump has been exaggerated by the media (and the opposing party). Think of all the investigations into Trump, that ultimately yielded no results. The left will tell you he got away with it. The right says there’s nothing there–so nothing was found. Now look at the current shenanigans going on with the election. The right is fighting to “not allow corruption to go unchecked within the election”. The left claims there’s no evidence of corruption, and argues it’s not right to even audit the process because the claims are baseless.
If either side’s arguments seem ridiculous to you, it’s most likely because your social circles & news feeds lean one way. But nearly half the country is in the other boat–and whatever their views, I find they aren’t ridiculous when you take the time to understand their perspective then view it through their lens. A lot of it, unfortunately, comes down to which narrative you trust. I firmly believe most media is bias. https://www.allsides.com/media-bias/media-bias-ratings gives allside’s opinion on biases (other sites produce similar charts as well, with slightly different results).
For example, I’ve heard the following fears expressed about Biden:
* Fear about an increase in crime (defund the police–which Biden is against, but a loud faction within the Democratic party is fueling it).
* Fear that Biden is simply a puppet, and more extreme left ideas will “make their way in” as a result of him being elected.
* Fears surrounding the Supreme Court (pack the court, turning the supreme court into a super-legislature)
* Fear that individual rights will be oppressed (Will there be another health care mandate penalty? Will we be required to wear a mask across the entire country, even if there are areas that don’t necessarily need to according to some opinions?)
* Fear about religious freedom (the left is in favor of large protests during covid, yet they’ll prevent congregations from worshiping their God).
* Fear that there’s corruption with the election (& Biden himself)
* Fear about an increase in terrorism (they believe Trump’s decisive leadership put a stop to it, where a more tolerant response would allow it to sprout up again)
* Fear about reduced income if you’re a Doctor or other medical worker, due to the governments involvement in medicine.
I’m sure there’s more–these are just the ones I’ve heard since the election. The point is though, we need to check ourselves. You expressed a “close call” with Trump–other’s are currently saying the same about Biden.
About somebody without a majority becoming chancellor: As far as I know this hasn’t happened in Germany yet, but it’s somewhat common in other countries. Sweden for example had several minority governments. Meaning the governing coalition actually doesn’t have a majority in the parliament and always has to get at least one opposition group on board when they want to pass a law.
About the other points: I don’t think that conversation is going to lead anywhere. It’s essentially saying that since nobody is perfect, all politicians are equally bad. No matter who is president, there will always be plenty of people unhappy about that. That doesn’t mean that all presidents are equally bad though. It’s possible to have a good conversation about this topic, but we’re already off to a bad start, so this won’t be it.
Also the “most media is bias” narrative leads to cynicism, nihilism, and giving up on the issues. I don’t think most media is bias. For example I read the New Yorker, which is a very left-leaning magazine. But they published a scathing article about New York’s response to the coronavirus:
https://www.newyorker.com/magazine/2020/05/04/seattles-leaders-let-scientists-take-the-lead-new-yorks-did-not
In fact if you Google for similar terms, you will find plenty of left-leaning magazines criticizing both De Blasio and Cuomo. (and you’ll of course also find plenty of idiots who praise Cuomo’s response) This is what a healthy media landscape looks like. This kind of reporting led to New York now doing much better. Other parts of the country didn’t have that kind of reporting, and those parts of the country have also given up on trying to do anything about the coronavirus. And then it’s a self-fulfilling prophecy: Since the media reports that nothing can be done about the virus, nothing gets done, and nobody is responsible, and then you find yourself in a situation where you’re so far behind, so powerless, that there actually is nothing that you can do. You can see similar conversations about healthcare reform or about global warming or similar large problems: Once you develop that kind of cynicism, you give up on the issues and then you actually do find yourself powerless, even though there would have been plenty that you could have done if you just hadn’t given up.
What’s a more healthy attitude about journalism specifically? Read people who put a lot of work into their writing, including the work to try to prove themselves wrong before publishing. Doesn’t matter if they’re left or right or center. If somebody clearly put a lot of work into their writing, and there aren’t any obvious flaws that could have been uncovered with just five minutes of research, then it’s probably worth reading. And yes, there are always small flaws in every piece of writing, but that brings me back to the beginning of this comment: Nobody is perfect, and the ability to list small flaws or potential misinterpretations doesn’t disqualify the writing. In the end the goal is to form a more informed opinion than “everyone and everything has flaws.”
I’m not arguing journalism is worthless. I’m arguing you shouldn’t accept it without accounting for bias, which includes considering other perspectives that could be argued. It wasn’t my intention to say give up on journalism. I’m arguing read both sides–that way you’re better equipped to find flaws. Another journalist from the “other side” who writes about a similar topic can probably help point out flaws that you miss in your 5 minute research.
With that being said, I’m more than happy to leave the conversation as is. It’s been fruitful. I’ve learned new things thanks to you, and I appreciate it.
Matt, danke schön for the data sources. By chance, do you happen to have a CSV file for the 2020 elections, too? If so, would you mind sharing it on GitHub? Thanks.
I found one comment odd, as an American; Obama is a relatively far left politician. Biden by proxy. Clinton seems indeed relatively center. Trump is conservative, but only for ‘our time’, and he represents more of a libertarian point of view on executive policy.